游戏广告
应用广告
网站广告
Google 搜索广告
W2A 落地页NEW
App 投放榜NEW
网站投放榜
访问量排行
独立站店铺投放榜
独立站商品投放榜
独立站商品热度榜
全球品牌榜
中国出海榜
TikTok 买量大盘
营销日历
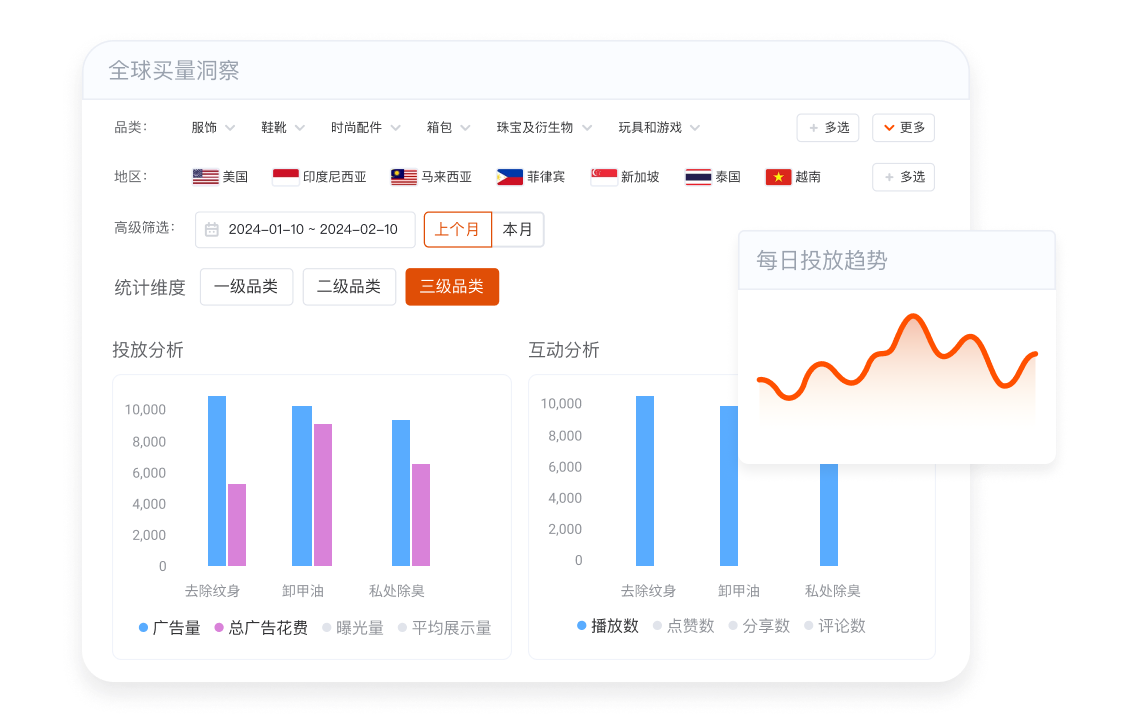
卖家必读!帮你探索 TikTok 该做什么品类。