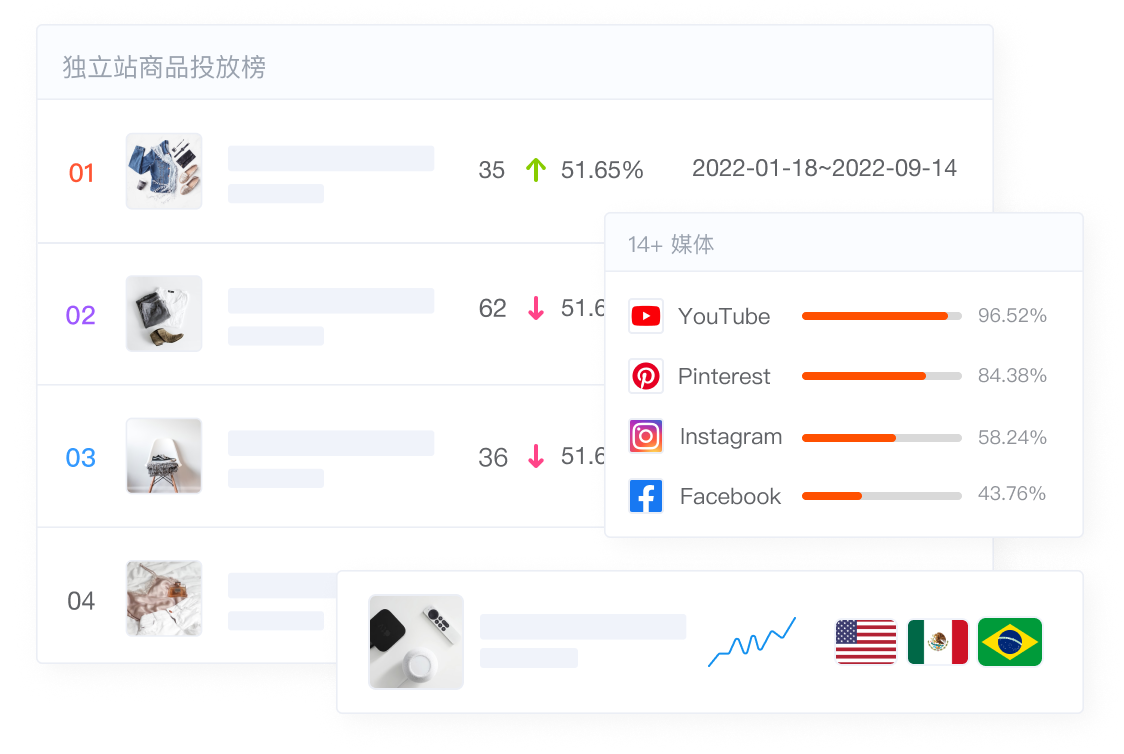

独立站商品投放榜
全球独立站商品榜单,实时追踪起量的新品及爆品
| # | 商品 | 价格 | 新投放广告数 | 新投放广告数环比变化 | 在投放广告数 | 在投广告数环比变化 | |
|---|---|---|---|---|---|---|---|
| 01 | 39.99 USD | 0 | - | 560 | - | ||
| 02 | 179.00 EUR 190.43 USD | 0 | - | 533 | - | ||
| 03 | 69.98 USD | 0 | - | 399 | - | ||
| 04 | 43.00 ~ 44.00 USD | 1 | 98.11% | 275 | 0.36% | ||
| 05 | 36.00 USD | 0 | - | 228 | 13.64% | ||
| 06 | 169.00 AUD 119.02 USD | 0 | - | 220 | - | ||
| 07 | 49.99 ~ 210.35 USD | 0 | 100.00% | 212 | 1.92% | ||
| 08 | 29.98 ~ 164.94 USD | 0 | 100.00% | 200 | - | ||
| 09 | 63.99 ~ 67.98 USD | 0 | - | 199 | - | ||
| 10 | 159.94 AUD 112.64 USD | 0 | 100.00% | 189 | - | ||
| 11 | 699.00 ~ 1,699.00 USD | 0 | - | 189 | - | ||
| 12 | 135.00 USD | 0 | 100.00% | 183 | - | ||
| 13 | 118.00 USD | 0 | - | 183 | - | ||
| 14 | 54.99 ~ 239.99 GBP 68.74 ~ 299.99 USD | 0 | - | 182 | 9.00% | ||
| 15 | 247.99 USD | 0 | - | 179 | - | ||
| 16 | 19.98 ~ 39.99 USD | 0 | 100.00% | 177 | - | ||
| 17 | 205.00 PLN 46.49 USD | 0 | - | 166 | - | ||
| 18 | 16.00 ~ 59.00 EUR 17.03 ~ 62.77 USD | 0 | 100.00% | 161 | - | ||
| 19 | 119.94 AUD 84.47 USD | 0 | 100.00% | 160 | - | ||
| 20 | 65.00 USD | 0 | - | 153 | 2.55% |